Feature guide
Your agency's dashboard
Build your dashboard with the widgets you need, in the order and size you prefer, and understand what each widget tells you about your clients, your money and your site.
In this guide
Where it is
It's the first item in the side menu when you're in your agency's workspace: Dashboard. If you're inside a brand or a client's account, go back to Agency Workspace from the selector at the top left.
The first time, the agency's owner sees the Get your agency ready to work card at the top of the dashboard, with the first steps. They can tap Skip for now and pick it up later.
When something is waiting for you, these notices also appear at the top of the dashboard:
- You have one brand waiting for your approval (or how many there are): a client filled out their form and their brand is ready. Until you approve it, your client can't see it. Tap Review and approve next to their name to go into their account and review it (see Approve the brand the AI put together).
- One client was left without their brand (or how many there are): the client filled out their form, but their brand couldn't be created. The notice tells you why and what to do. Tap Try again to retry, or Create the brand manually to go into the client's account and create it yourself. This notice doesn't go away on its own: it stays until the brand exists.
Customize the agency dashboard
- In the bar at the top of the dashboard, tap Customize widgets. You'll see the Edit mode label.
- If you want, change the dashboard's name in the field on the left.
- A list opens on the right with three tabs:
- Widgets: the blocks with data, grouped by topic. Look for one with Search widgets and tap Add. The ones already on your dashboard say On the dashboard.
- Elements: a Title to split the dashboard into sections and a Note for a reminder or a goal. Type directly on them in the dashboard.
- Themes: the color of the charts, buttons and accents (for example Your brand color, Ocean or Forest). The green, amber and red of the statuses don't change: they always mean the same thing.
- On each widget in the dashboard you can:
- Drag it by Move to change its place.
- Choose its size: Small, Medium or Large (not every widget allows all three).
- Choose the chart type, when the widget has more than one: Numbers, Donut, Line, Bars, Horizontal bars or Table.
- Hide it. Hiding doesn't delete anything: you go back to the list and add it whenever you want.
- Tap Save changes. You'll see Dashboard saved. If you change your mind, tap Cancel and the dashboard stays as it was.
Have several dashboards
You can have several named dashboards, for example one for money and another for production:
- Tap New to create one. You'll see "Dashboard created. Give it a name and pick its widgets."
- Switch dashboards with the selector that shows the name of the open dashboard.
- To delete one, go into Customize widgets and tap Delete dashboard. Only that dashboard and its layout are deleted: your agency's data isn't touched.
If you see "You already have the maximum number of dashboards. Delete one to create another.", delete one you no longer use.
Choose the dates
The Last 30 days button (or 7, or 90) on the bar changes the dates of all the widgets that use dates. If a widget needs different ones, change them from its own date label without going into customize mode: that widget keeps its own. Account activity can also show just Today.
If you have several sites, the Site selector lets you see your website widgets for just one of them or for All sites.
What your team sees
Each person has their own dashboard: what you customize doesn't change your team's. The money widgets and your website widgets are only visible to the agency's owner; on your dashboard they carry the Only you label.
What each dashboard widget shows
Summary
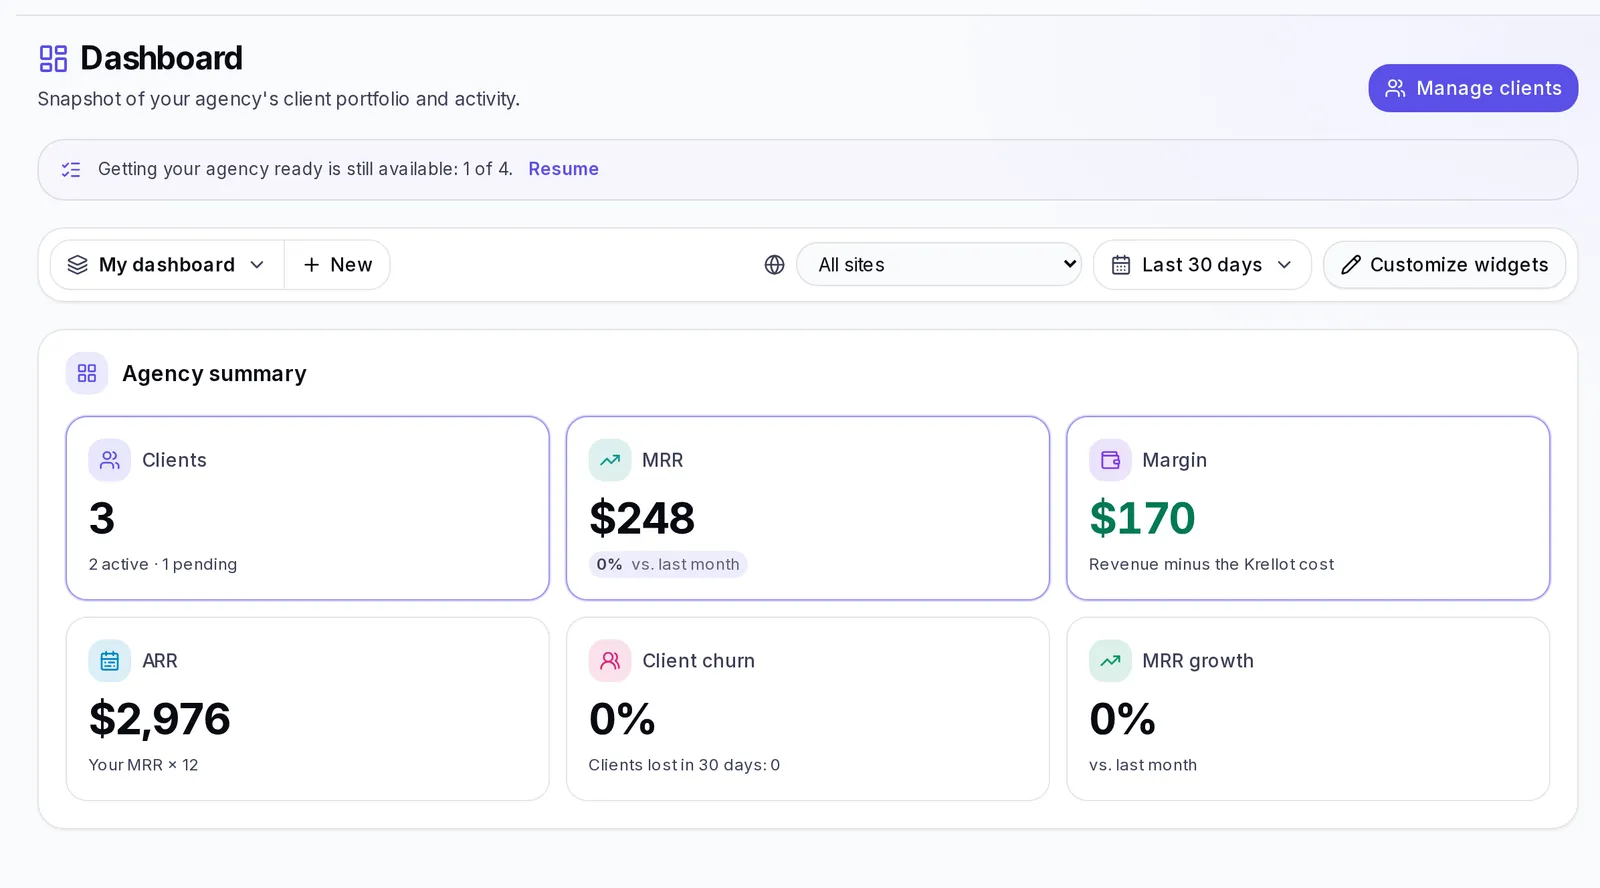
- Agency summary: it shows up at the top of the dashboard, although you can move it or hide it like any widget. It shows you Clients, MRR (monthly revenue), ARR (yearly revenue), Margin, Client churn (clients who left) and MRR growth, each one compared with the previous month when there's something to compare it with. Your team sees Clients, Client churn, Brands and Content produced here.
Finances (owner only)
- Financial performance: what your clients pay you (Revenue), what you pay Krellot for your seats (Krellot cost) and what you keep (Margin). If the margin comes out negative, you'll see "You're losing money — review your pricing". From here, Manage billing takes you to your subscription.
- MRR over time: how your monthly revenue changes month to month, with the Average revenue per client. Choose the Period you want to see. Months marked as approximate are an estimate.
Clients
- Client status: how many are Active, Pending, Suspended and Canceled.
- Waiting on you: pending approvals and transfers. If there's nothing, it says "All caught up. Nothing is waiting on you."
- Account activity: what each client has done in the chosen dates. Use Filter by account to see just one.
- What your clients use (owner only): the sections of the app your clients visit most.
Your website (owner only)
- Website analytics: Visitors, Went to pay, New clients, Conversion and Typical time of a visit, with their trend.
- Conversion funnel: how many visitors went to pay and how many ended up as new clients.
- Forms submitted: how many responses your forms got each day.
- Button clicks: which buttons on your site get clicked the most.
- Where they come from: where the visits to your site come from.
- How they browse: your visitors' browsers and devices.
Production and shortcuts
- Production: the brands across all your accounts and the content produced (ideas, scripts and carousels).
- Quick actions: your shortcuts. Tap Edit shortcuts to Add from Krellot a screen (for example Manage plans, Client list or Reports) or Add your own link with a name and a full web address (for example, https://drive.google.com). Your own links open in another tab.
If something goes wrong
- A widget says "We couldn't load this data.": tap Retry.
- I don't see the money or site widgets: only the agency's owner sees them.
- A growth number doesn't show up: there's no previous month to compare with yet.
- I changed something and it didn't save: in Edit mode, changes are only kept when you tap Save changes.